Best application monitoring tools in 2026: the buyer's shortlist.
Compare eight application monitoring tools for SaaS engineering teams. See error tracking, tracing, logs, uptime, pricing, and the fit for your stack.
Your app can be online and still fail the customer trying to use it. A checkout throws an error, a request takes too long, or a background job stops running without anyone noticing.
The right monitoring setup tells your team what happened and gives the developer enough context to investigate. The buying decision is how much of that work belongs in one platform.
This 2026 shortlist compares eight application monitoring tools. Sentry takes the top spot for developer-first error tracking connected to traces, session replays, and an AI debugger.
Key Takeaways
The short version, before you compare the tools.
Start with the production problem you need to explain. Error tracking captures failures in your code. APM follows application performance, while broader observability brings infrastructure and logs into the investigation. Uptime checks test whether the service responds from outside.
Sentry leads for developers who own the fix. Errors, logs, replays, and spans connect through the same trace. Team costs $26 per month billed annually, with unlimited users; the Seer AI Debugger is a separate add-on at $40 per active contributor per month.
Full-stack coverage has its own buying model. Datadog prices infrastructure, APM, and logs separately. New Relic includes 100 GB of monthly data ingest free, then charges for additional data and the users who need paid access.
Incident response is part of the setup. Better Stack combines telemetry with on-call, incident management, and status pages. Decide who needs a phone alert, who needs dashboard access, and how you will communicate an outage before comparing subscriptions.
Predictable pricing means understanding the limit behaviour. Rollbar stops processing events at the plan limit by default. AppSignal promises no overage charges and continued monitoring when you cross limits. Those policies produce different operating decisions during an incident.
AI access and AI fixes are different features. An MCP server brings monitoring context into an assistant. Rollbar Resolve writes a fix, runs your tests, and opens a pull request for approval. Compare the actual action each assistant supports.
What application monitoring tools actually do (and what they don't)
Application monitoring collects signals from running software so you can understand failures and slow behaviour. Error tracking records exceptions with context such as a stack trace. Logs record what the application reports along the way. Traces follow work across operations, and performance monitoring helps you locate where a request spends its time. Each signal answers a different question during the same investigation.
For a SaaS company, the useful unit is often a customer action. A signup can reach several services before it finishes. A checkout might succeed in the browser but leave a background task unfinished. You need enough context to follow that action, rather than a dashboard that shows a healthy server while customers struggle. Uptime and cron checks add another view by testing availability and whether scheduled work keeps running.
Monitoring does not replace automated tests, a release process, or a person responsible for responding. A captured exception needs an owner, and an AI-generated patch needs review. Agree which failures deserve an interruption and which belong in the normal development queue.
Start with a customer journey and an engineer who owns it. Reliability belongs in your retention discussion, though monitoring alone cannot explain a cancellation. Use the free SaaS churn calculator to model how retention assumptions affect revenue.
How We Ranked These Application Monitoring Tools
This shortlist evaluates monitoring for SaaS engineering teams investigating production errors, slow requests, and downtime. It includes focused error trackers, APM products, and broader observability platforms, with scope determined by who owns production in your company.
The comparison uses public pricing, product pages, and vendor documentation. The ranking assesses capability and buying fit rather than benchmark performance.
We compared five criteria:
Error investigation. Stack traces, error grouping, deploy context, user impact, and session replay. These help the developer locate the code that needs attention.
Performance and telemetry. Tracing, logs, metrics, and infrastructure context. We distinguish application-level investigation from a platform that also covers hosts, databases, and security.
Alerting and response. Notifications, uptime checks, cron monitoring, incident management, on-call, and status pages. These connect the signal to a response.
Developer and AI workflow. Setup, engineering-tool integrations, OpenTelemetry support, MCP access, and the actions an AI debugger or agent can take. Reading error context and proposing a tested code change are assessed separately.
Cost and capacity. Events, requests, hosts, data ingest, responder licenses, and user seats. We compare free allowances, billing terms, paid access, and what happens when usage reaches a limit.
Published customer results are attributed to the people reporting them. Prices retain their plan names and billing units throughout the guide. We plan to review this guide quarterly and after material pricing changes.
The Best Application Monitoring Tools in 2026
Choose the first tool around the investigation your team performs most often. A developer fixing exceptions needs different context from an on-call engineer investigating a host or database problem. These eight products cover that range, with different ways to charge for the data you collect and the people who use it.
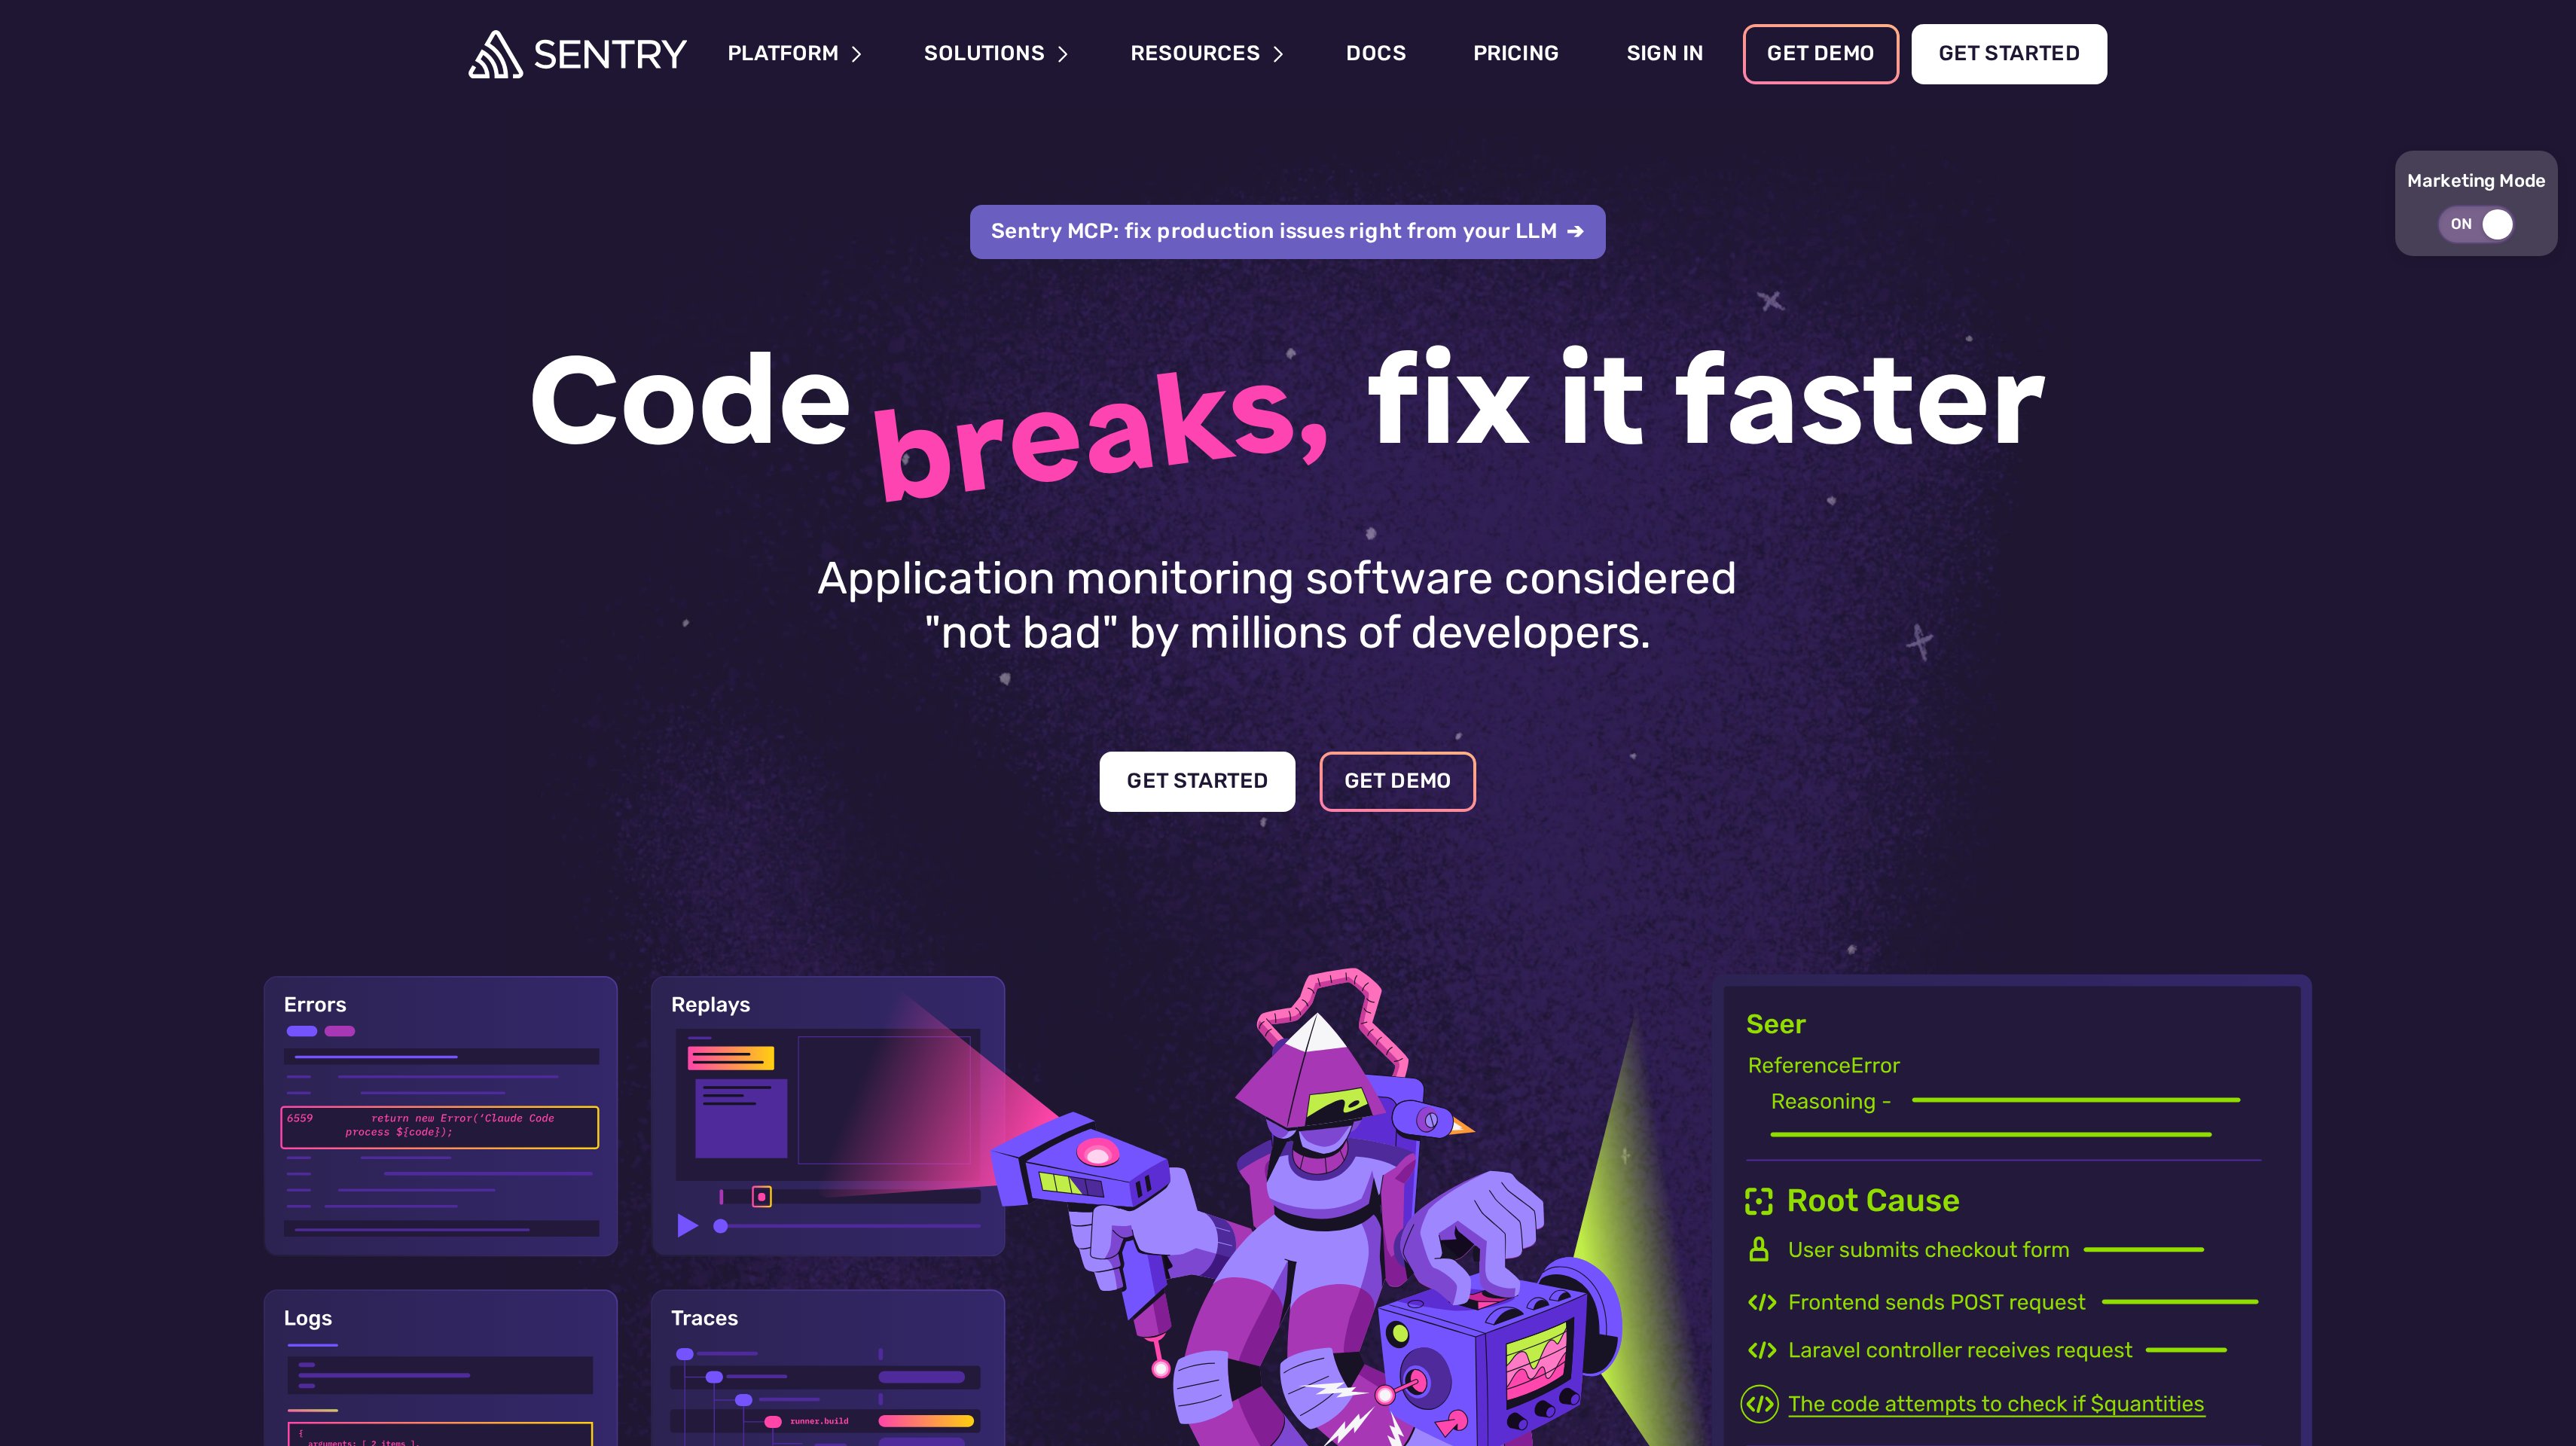
1. Sentry, best for developer-first error tracking with tracing and AI debugging
Sentry connects application errors, logs, session replays, spans, profiles, and metrics through the same trace. That gives you a way to investigate a failure alongside the request and user session around it. It leads this shortlist because the workflow centres on the developer diagnosing and fixing production code, with performance context available in the same platform.
Setup uses SDKs without agents to install. Sentry describes the initial SDK setup as five lines. GitHub, Slack, Jira, and Linear integrations connect investigations to engineering work. Its MCP server provides monitoring context through compatible AI tools, while agent tracing covers AI tool calls, spend, and performance.
Developer is free for one user, with error monitoring, tracing, email alerts, ten custom dashboards, and MCP access. Team is $26 per month billed annually at $312 per year, with unlimited users, API and third-party integrations, and 20 custom dashboards. Business is $80 per month billed annually and adds unlimited dashboards, advanced quota management, SAML, and SCIM. Enterprise has custom pricing. Events and data beyond plan quotas are billed by volume.
Seer adds an AI debugging agent and code reviewer. The Seer AI Debugger costs $40 per active contributor per month on Team, Business, or Enterprise. Budget for contributor access separately from monitoring.
Best suited for SaaS developers who want to investigate exceptions with the trace and replay that explain the affected request. Your team can connect that work to GitHub or Linear and bring error context into its AI workflow.
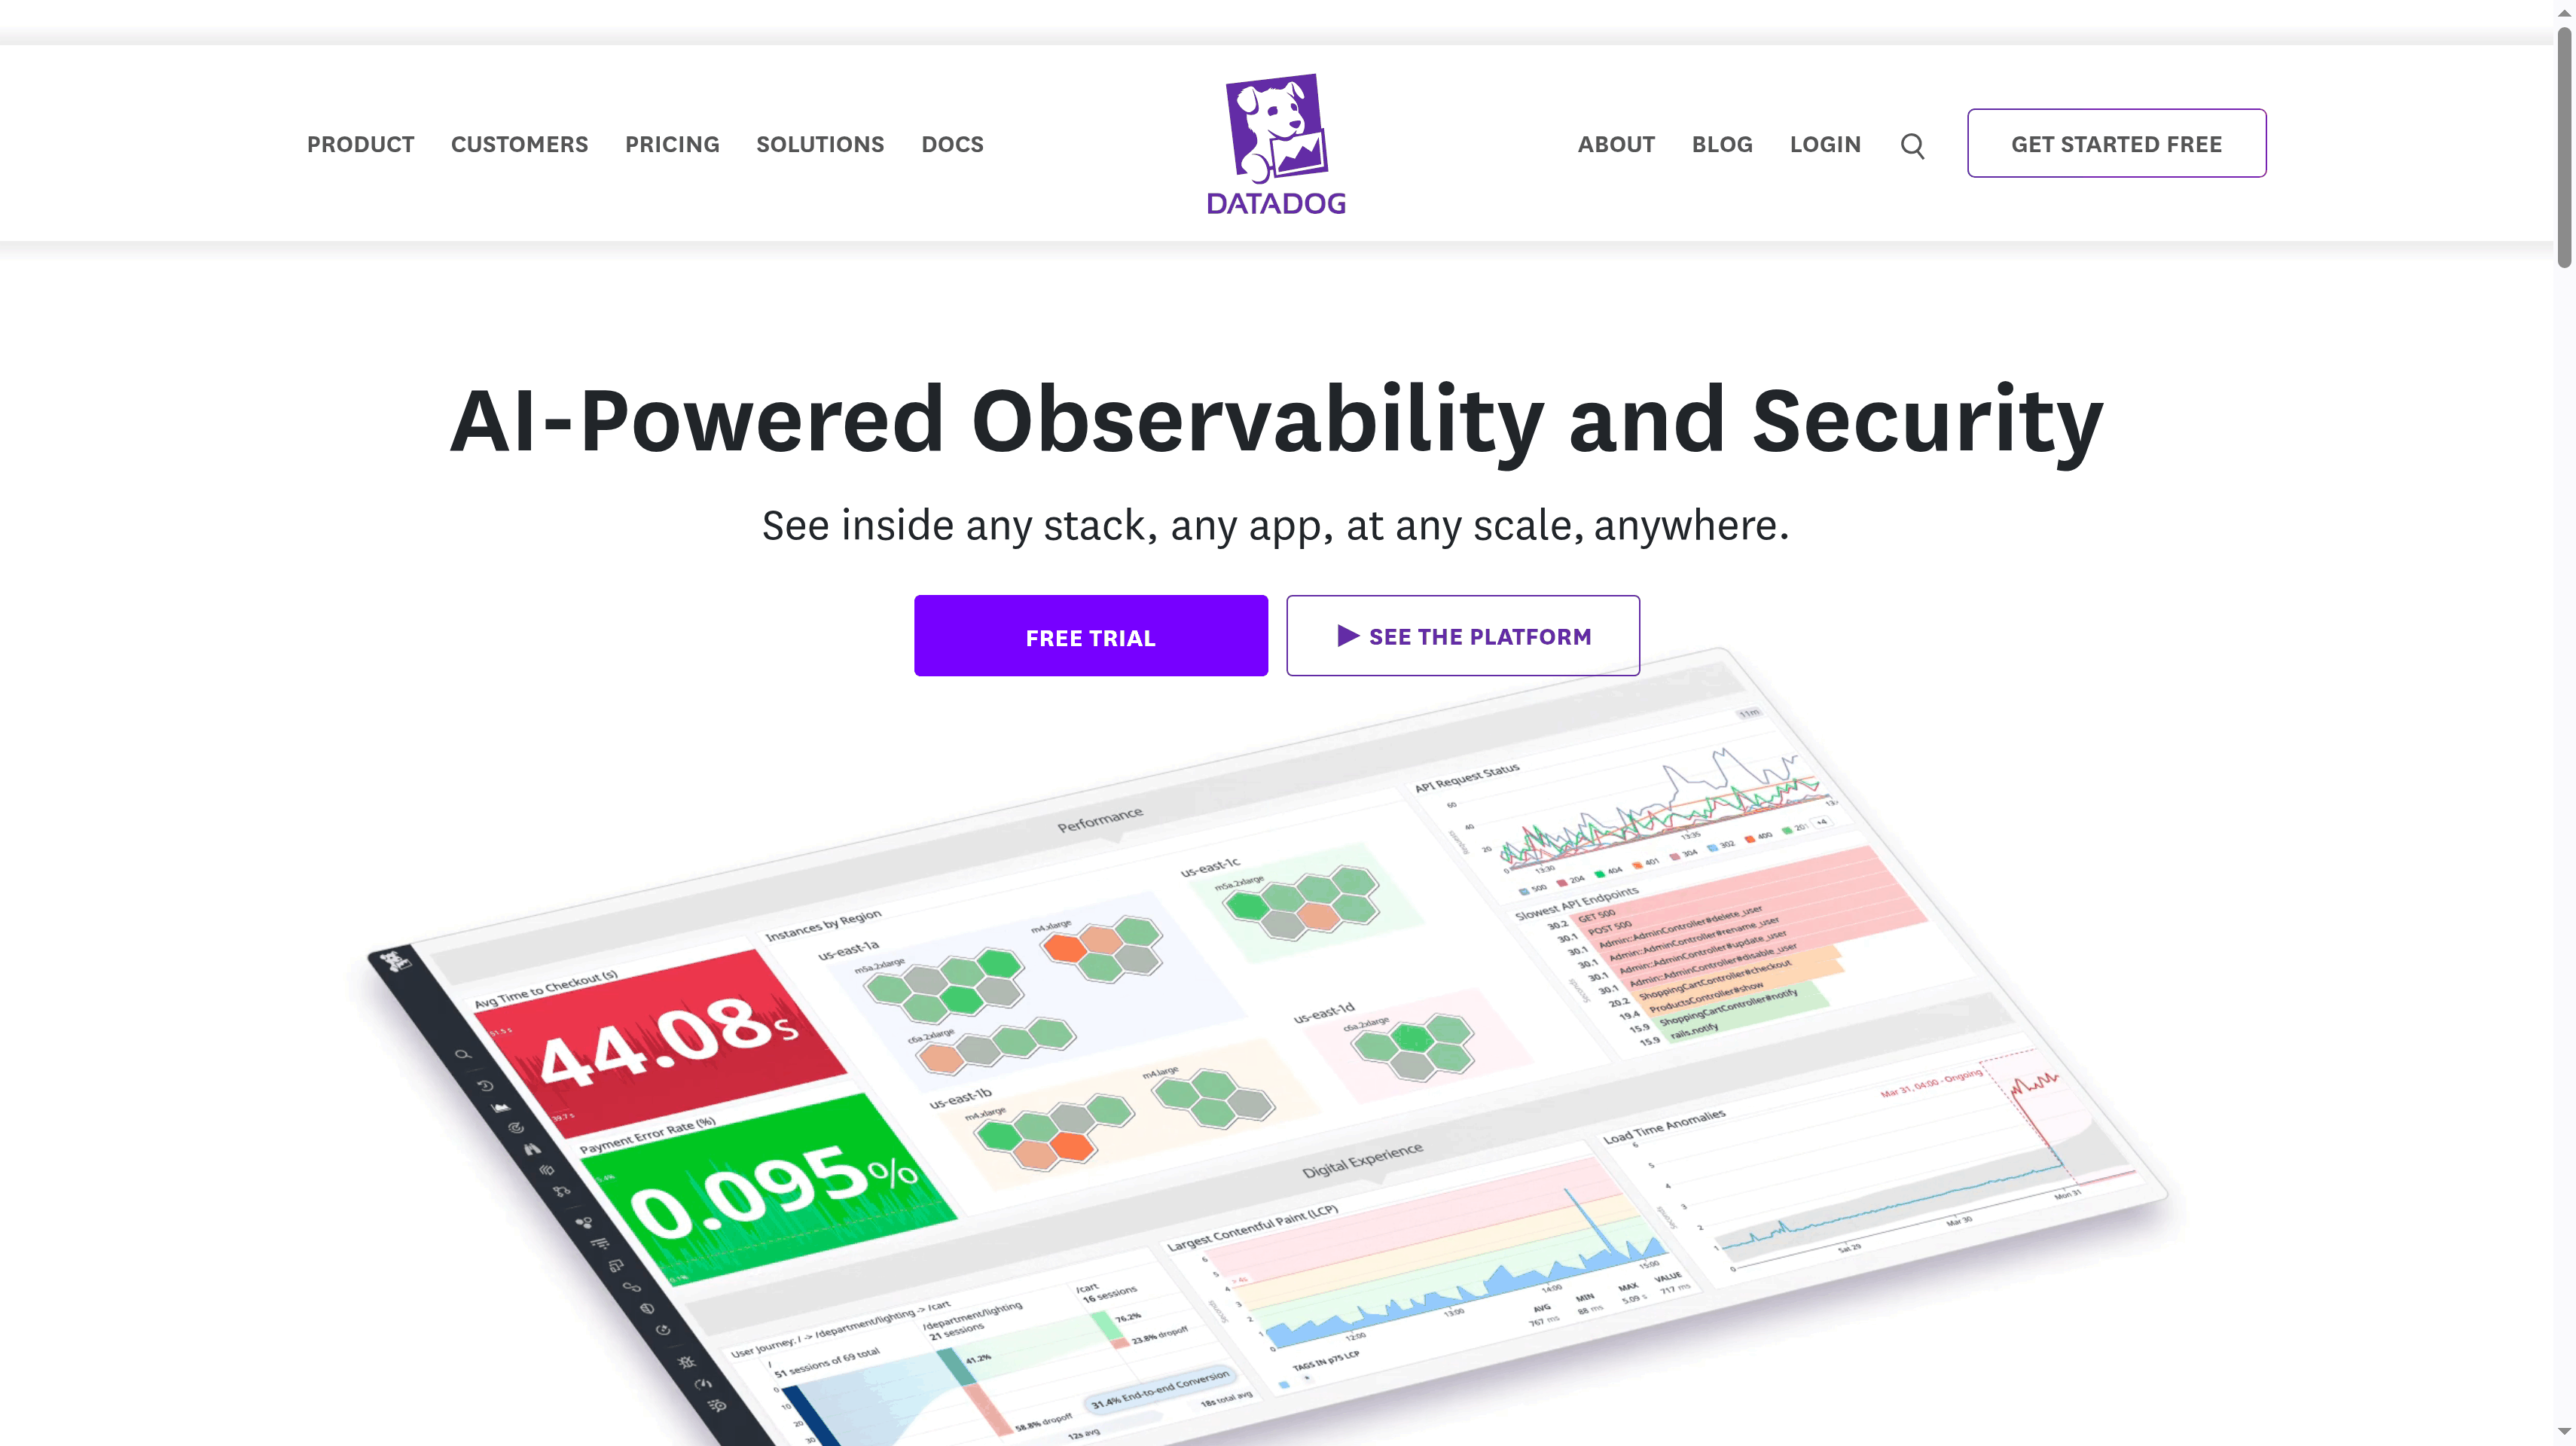
2. Datadog, best for full-stack observability across infrastructure, APM, logs, and security
Datadog brings infrastructure monitoring, APM, log management, error tracking, and security into one observability platform. Real user monitoring, session replay, synthetic monitoring, serverless, and database monitoring extend the coverage. The fit is a team whose production investigations regularly cross the application, the systems underneath it, and the experience in the browser.
Its catalog includes more than 1,000 integrations for operational context across your stack. Incident response and Bits AI sit alongside the monitoring products. Start your evaluation with a representative incident and identify which products that investigation would use.
Infrastructure Free costs $0 for up to five hosts, with core collection and visualization and one-day metric retention. Infrastructure Pro starts at $15 per host per month billed annually, or $18 on demand, and includes 15-month metric retention. Infrastructure Enterprise starts at $23 per host per month billed annually, or $27 on demand, and adds machine-learning alerts. A free trial is available.
Each product is priced separately. APM and logs add charges on top of infrastructure. Build your budget around the products you intend to enable and the hosts you expect to monitor.
Best suited for engineering and operations teams that need application, infrastructure, and security context in the same platform. It fits investigations where several specialists need to follow a production issue across different systems.
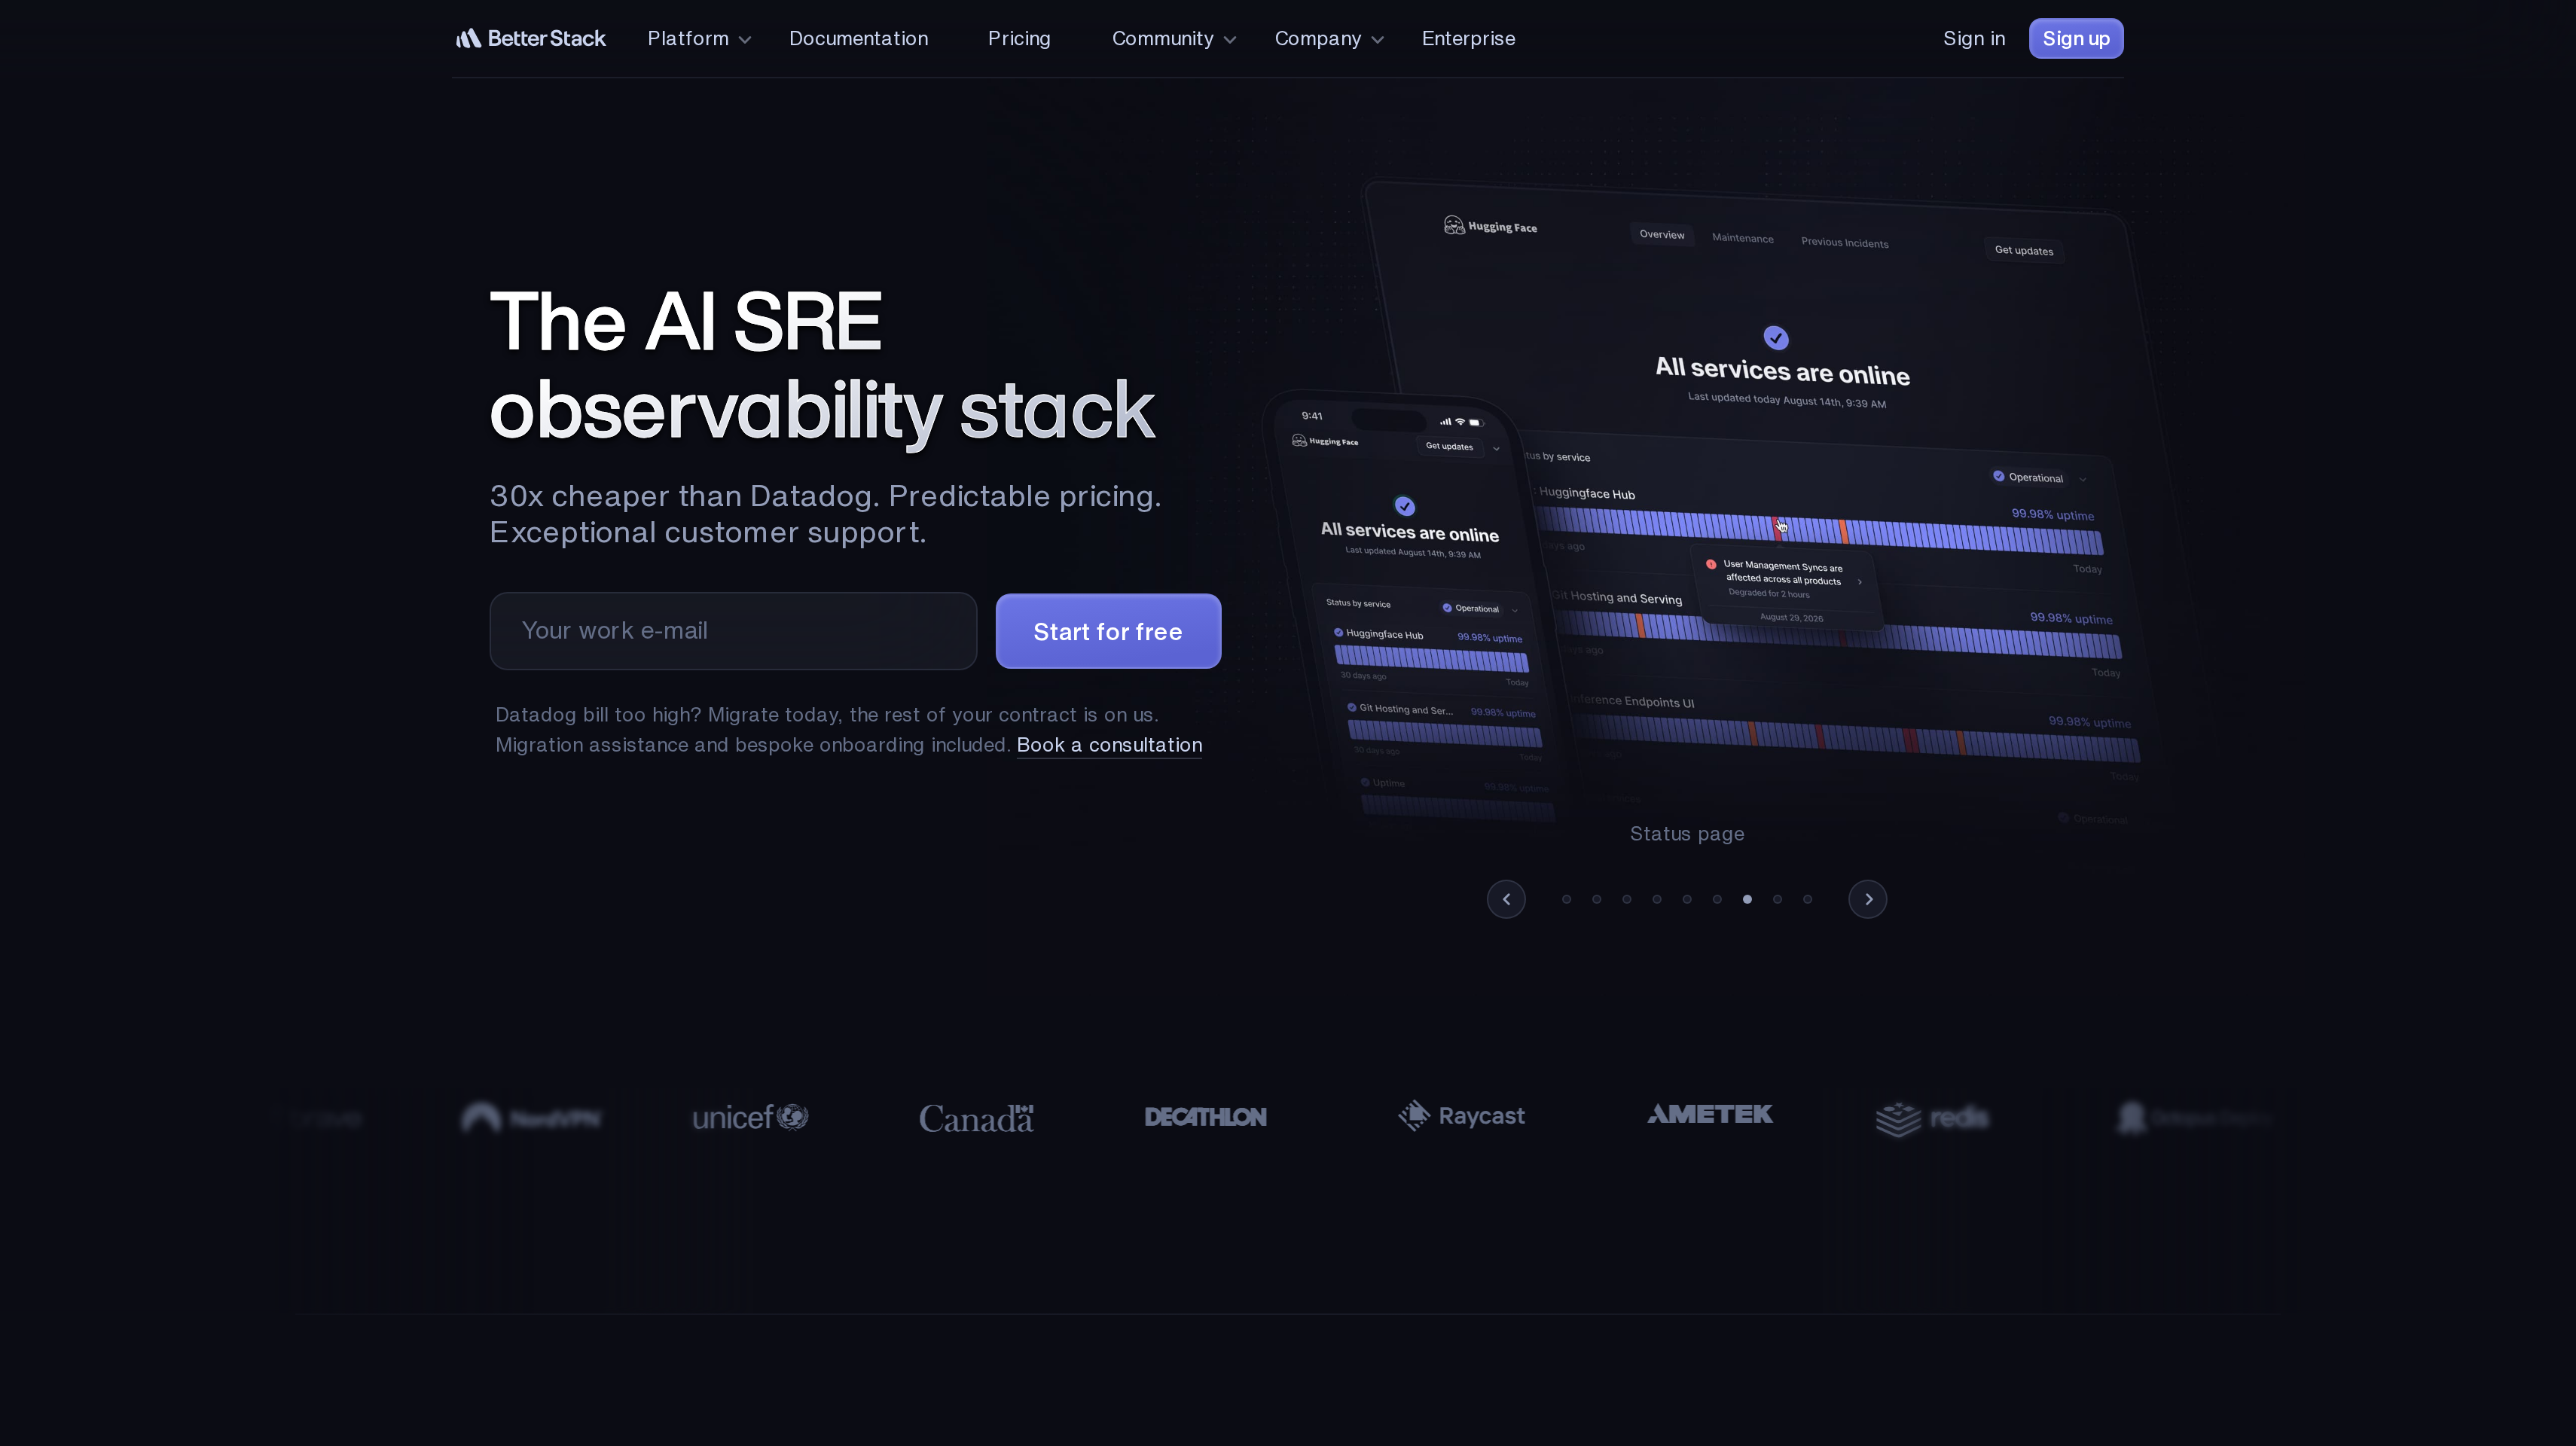
3. Better Stack, best for telemetry with uptime, on-call, and status pages
Better Stack combines observability with the work of responding to an incident. Log management, OpenTelemetry-native tracing, infrastructure monitoring, and error tracking sit alongside uptime and transaction monitoring. Heartbeats cover scheduled jobs, while incident management, on-call, and status pages help your team coordinate the response and communicate with customers.
That combination suits a SaaS team buying its response process and telemetry together. Evaluate request failures, missed scheduled tasks, and alert delivery in the same stack. Its AI SRE agent investigates incidents in Slack or Teams, and an MCP server gives compatible assistants access to monitoring context.
The free personal-project plan includes ten monitors and heartbeats, one status page, and Slack and email alerts. It also includes 100,000 exceptions per month, 5,000 session replays, 3 GB of logs, and 3 GB of traces. Logs and traces have three-day retention. Those are useful boundaries for deciding which application and scheduled jobs belong in an initial setup.
Paid responder licenses cost $29 per license per month billed annually, or $34 monthly. Each includes unlimited phone call and SMS alerts. Unlimited team members receive free access to telemetry, which is billed by usage. Keep the cost of waking a responder separate from the cost of collecting data when you estimate the subscription. Better Stack offers a 60-day money-back guarantee.
Best suited for teams that want to buy uptime checks, incident coordination, status communication, and telemetry together. Your on-call responders get phone and SMS alerts while the wider team can access telemetry without paid responder licenses.
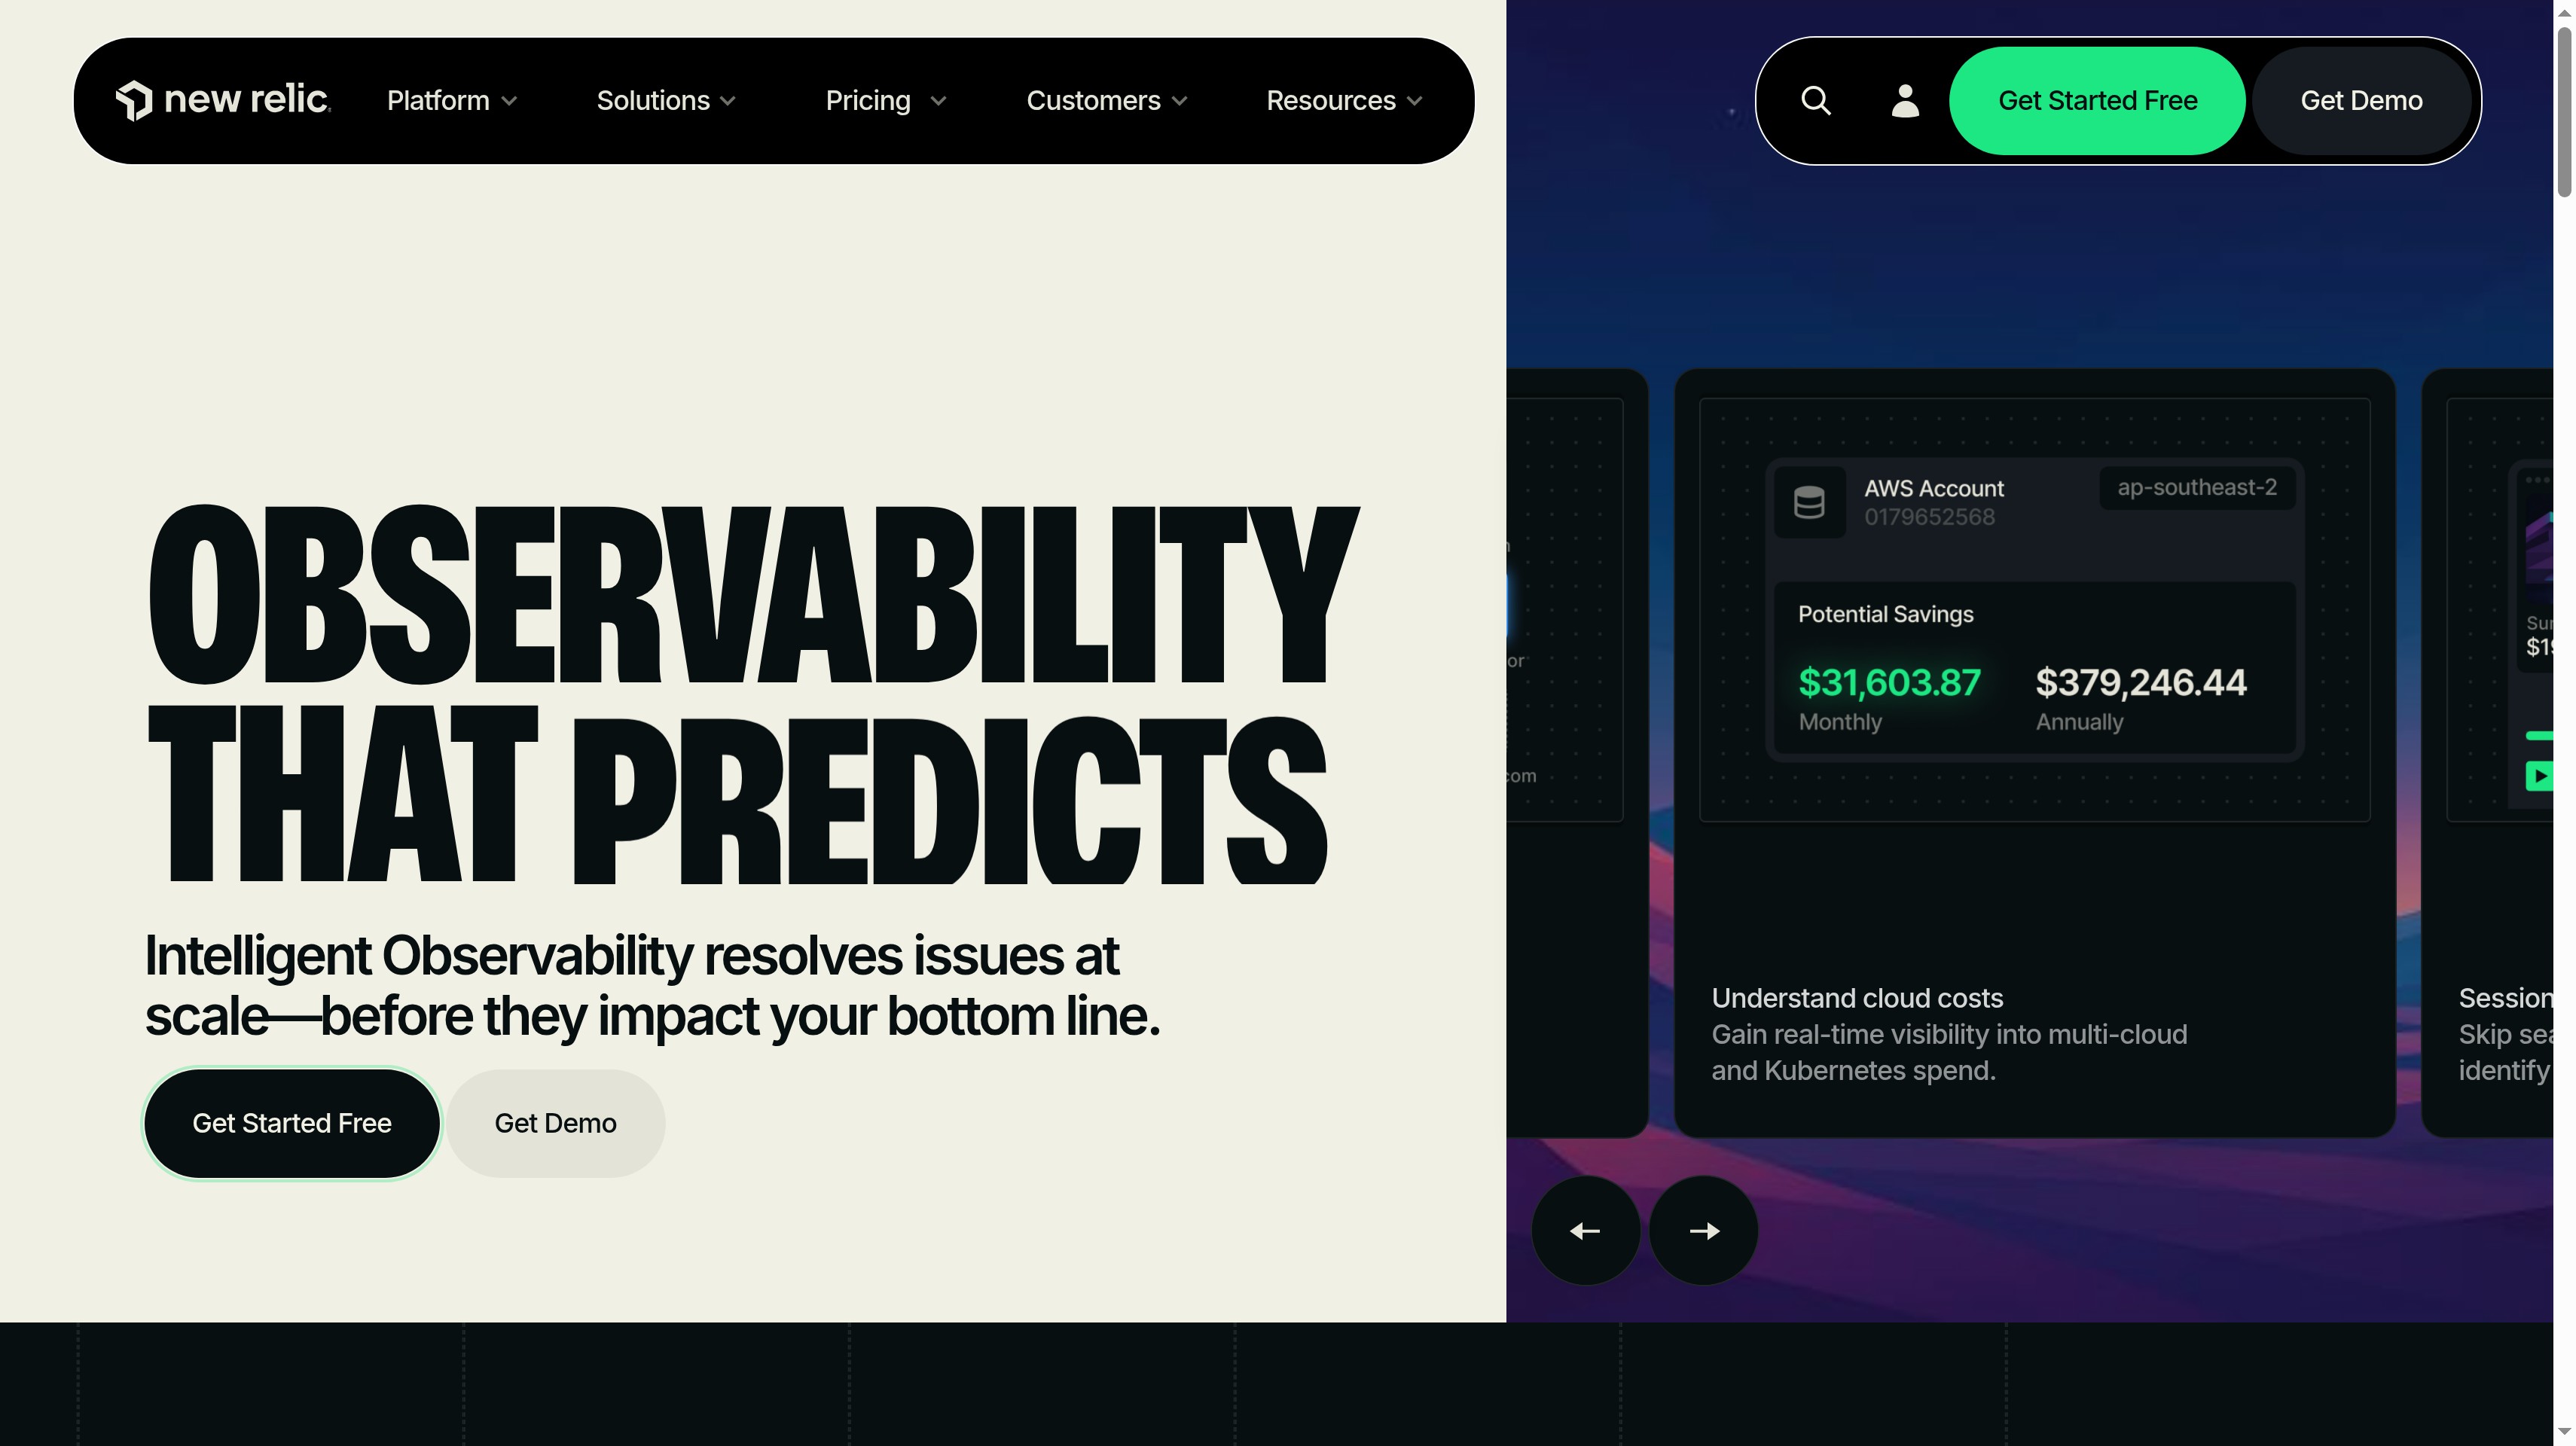
4. New Relic, best for usage-based observability with a generous free data tier
New Relic is an observability platform with more than 50 capabilities, including APM, infrastructure monitoring, logs, digital experience, and session replay. OpenTelemetry support, AI and agentic monitoring, and an SRE agent extend the developer workflow. It lists more than 780 integrations, so you can assess the wider stack alongside application performance.
The perpetual Free tier includes 100 GB of data ingest per month and one free full platform user, with no credit card required. Unlimited hosts carry no additional host charge. That makes data volume and access requirements the starting points for your budget, rather than the number of machines running the application.
Data beyond the included 100 GB costs $0.40 per GB, or $0.60 per GB for Data Plus. Basic users are free, and core users cost $49 per user per month. Standard lists its first full platform user at $10 per month and additional full platform users at $99 each per month, with a maximum of five. Pro full platform users cost $349 per user per month on an annual commitment, or $418.80 pay as you go. Enterprise pricing comes through sales.
List the access level each colleague needs before comparing the total. One full platform user has different economics from a team where everyone needs that access. Estimate ingest using the telemetry you intend to send, including logs produced during a failure.
Best suited for teams that want broad observability with a substantial free ingest allowance and no per-host charge. It fits a buying process where you can define both the data volume and the access each colleague needs.
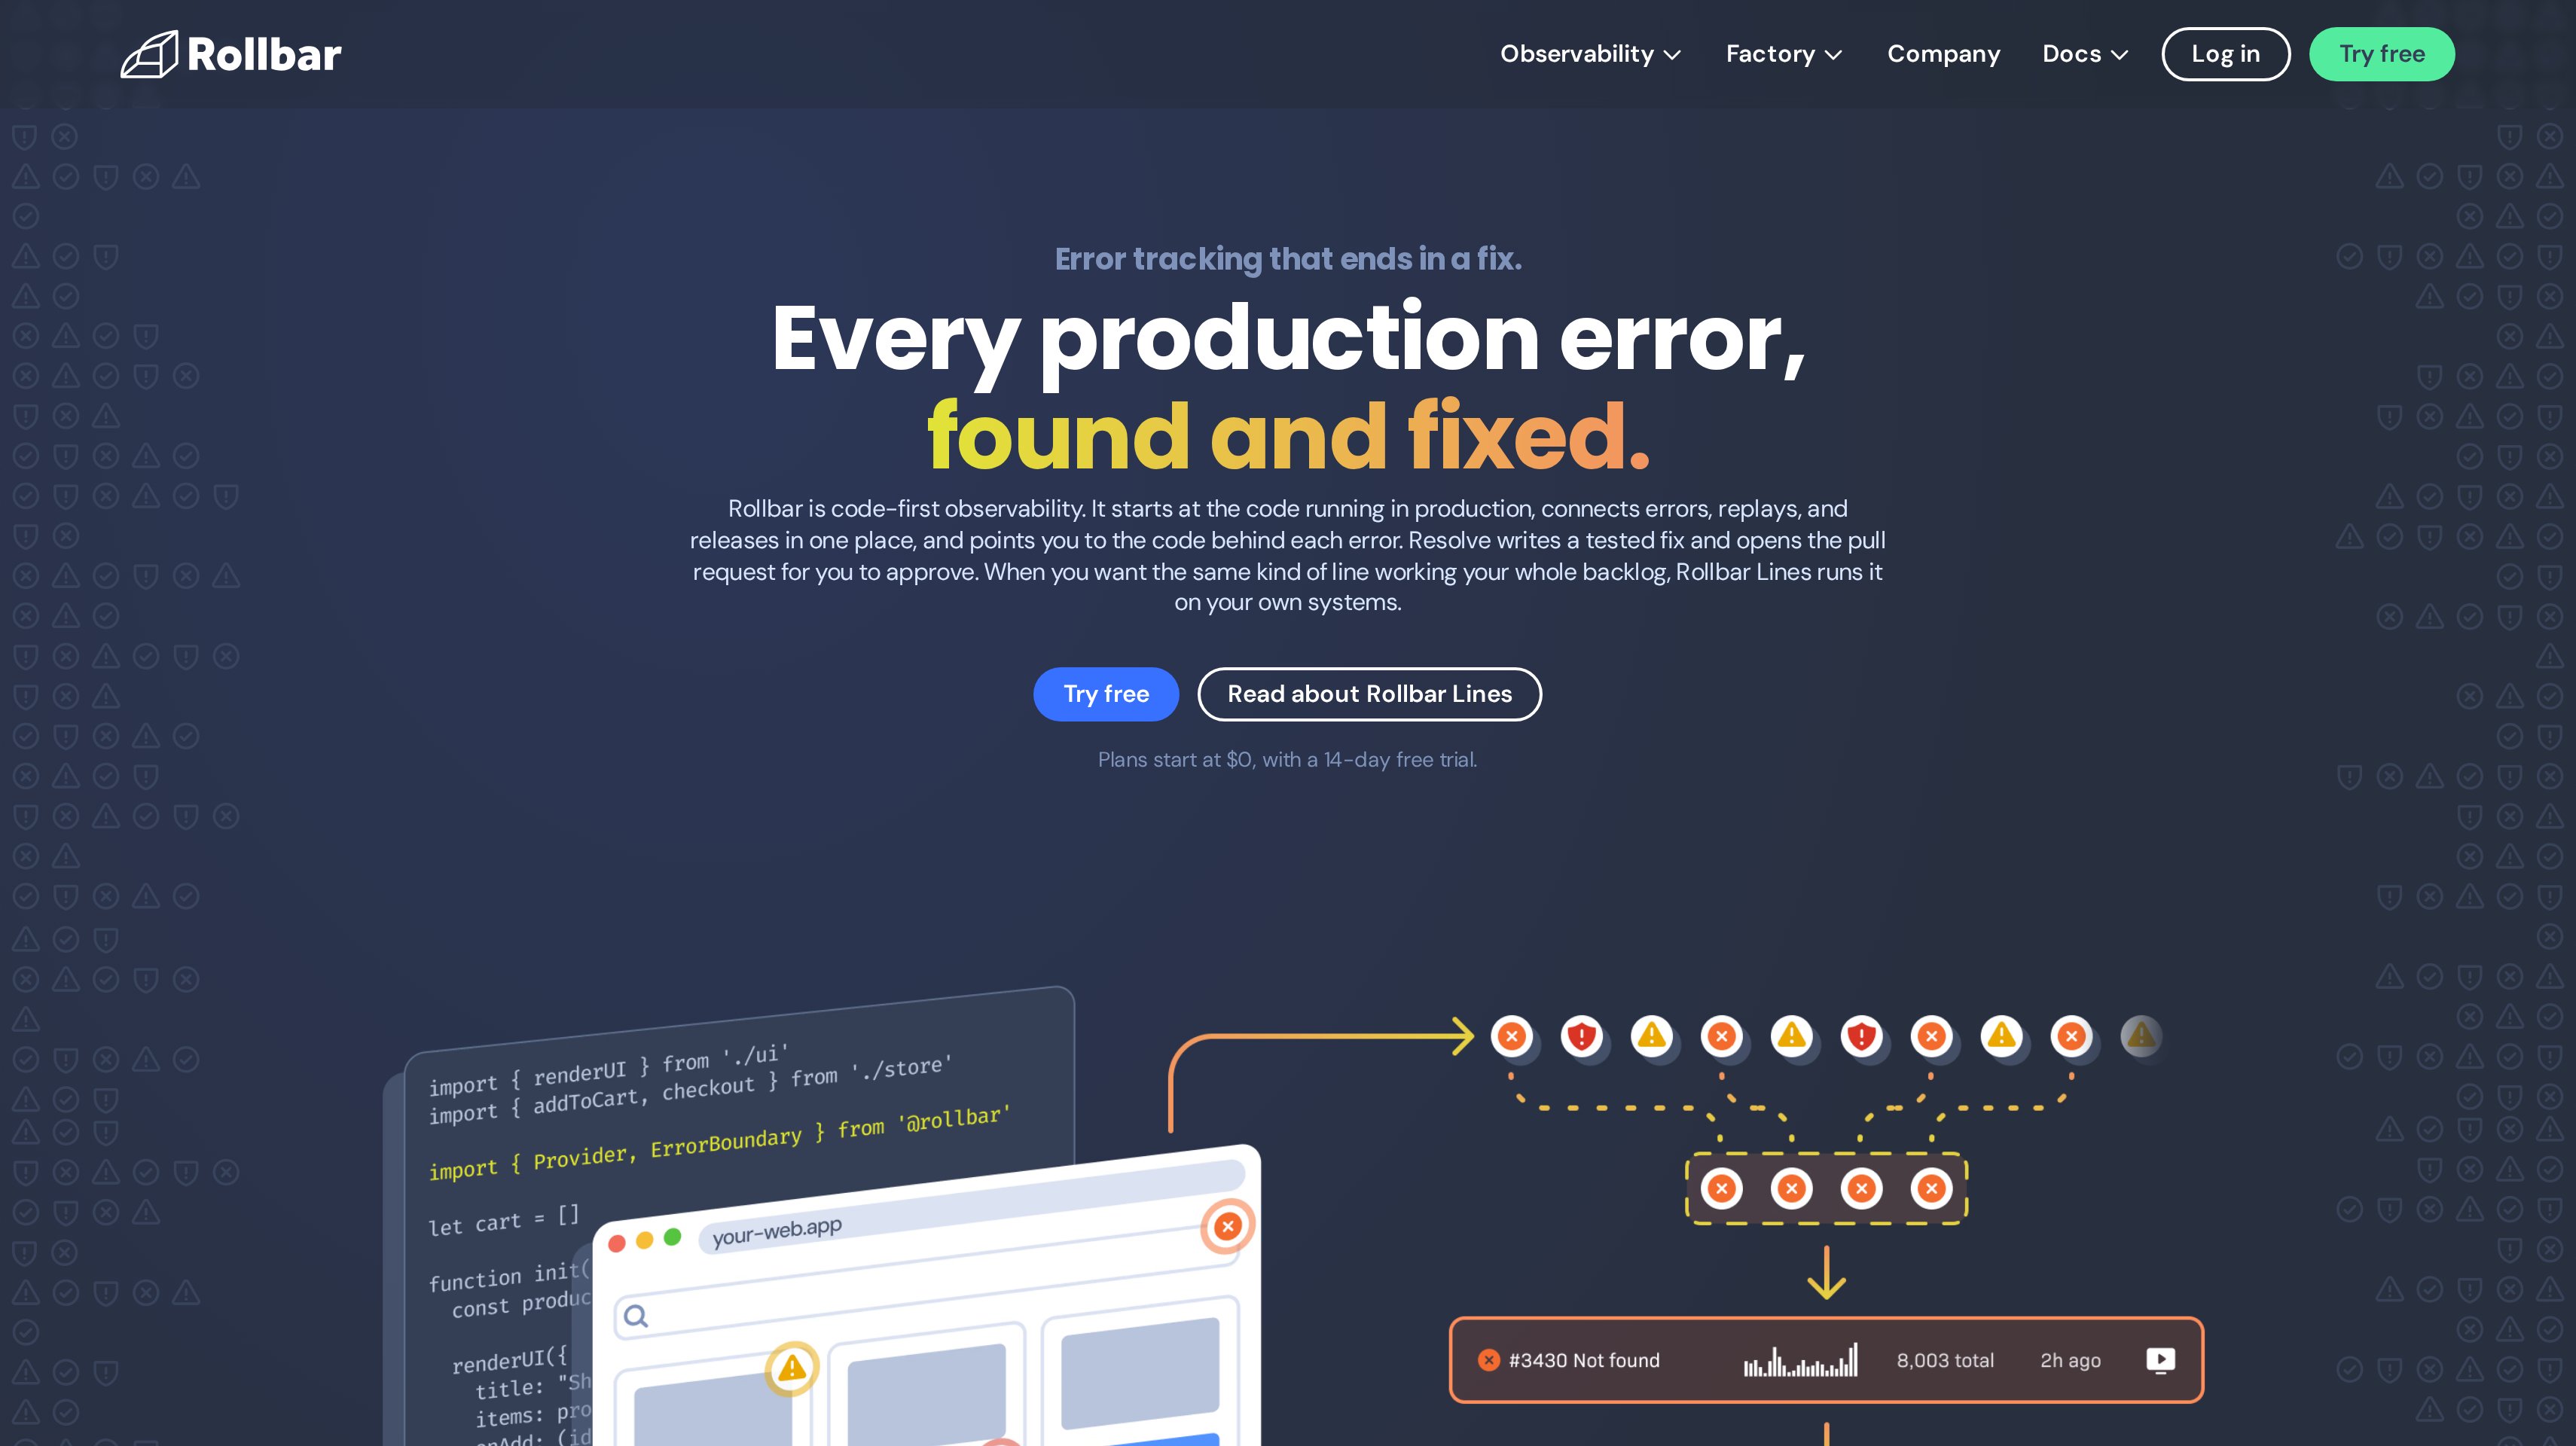
5. Rollbar, best for code-first error tracking with tested AI pull requests
Rollbar focuses on production errors and the code changes that resolve them. Error monitoring, intelligent grouping, session replay, and deploy and version tracking help you connect a failure to what shipped. Real-time alerts reach Slack, email, webhooks, and on-call tools, so the development team can receive errors through its existing response channels.
Rollbar Resolve writes a fix in an isolated environment, runs your tests, and opens a pull request for you to approve. Choose it when you want an assistant that proposes a code change. Your team still decides whether the tests cover the behaviour and whether the patch should ship.
Free costs $0 forever and includes 5,000 occurrences and 1,000 replays per month, 30-day data retention, and unlimited projects and users. Essentials has 90-day retention and 4K credits. Advanced adds adaptive alerts, SCIM, 180-day retention, and 8K credits. Essentials and Advanced are priced by volume, with custom Enterprise pricing. A 14-day trial includes the Advanced feature set.
By default, Rollbar stops processing events at the plan limit, so there are no surprise overage charges. Estimate occurrences during a noisy release as well as a normal day, and assign an owner for the usage limit alongside the error queue.
Best suited for development teams that want grouped production errors to feed a reviewed pull-request workflow. Resolve fits engineers who want an agent to run tests before proposing a patch for their approval.
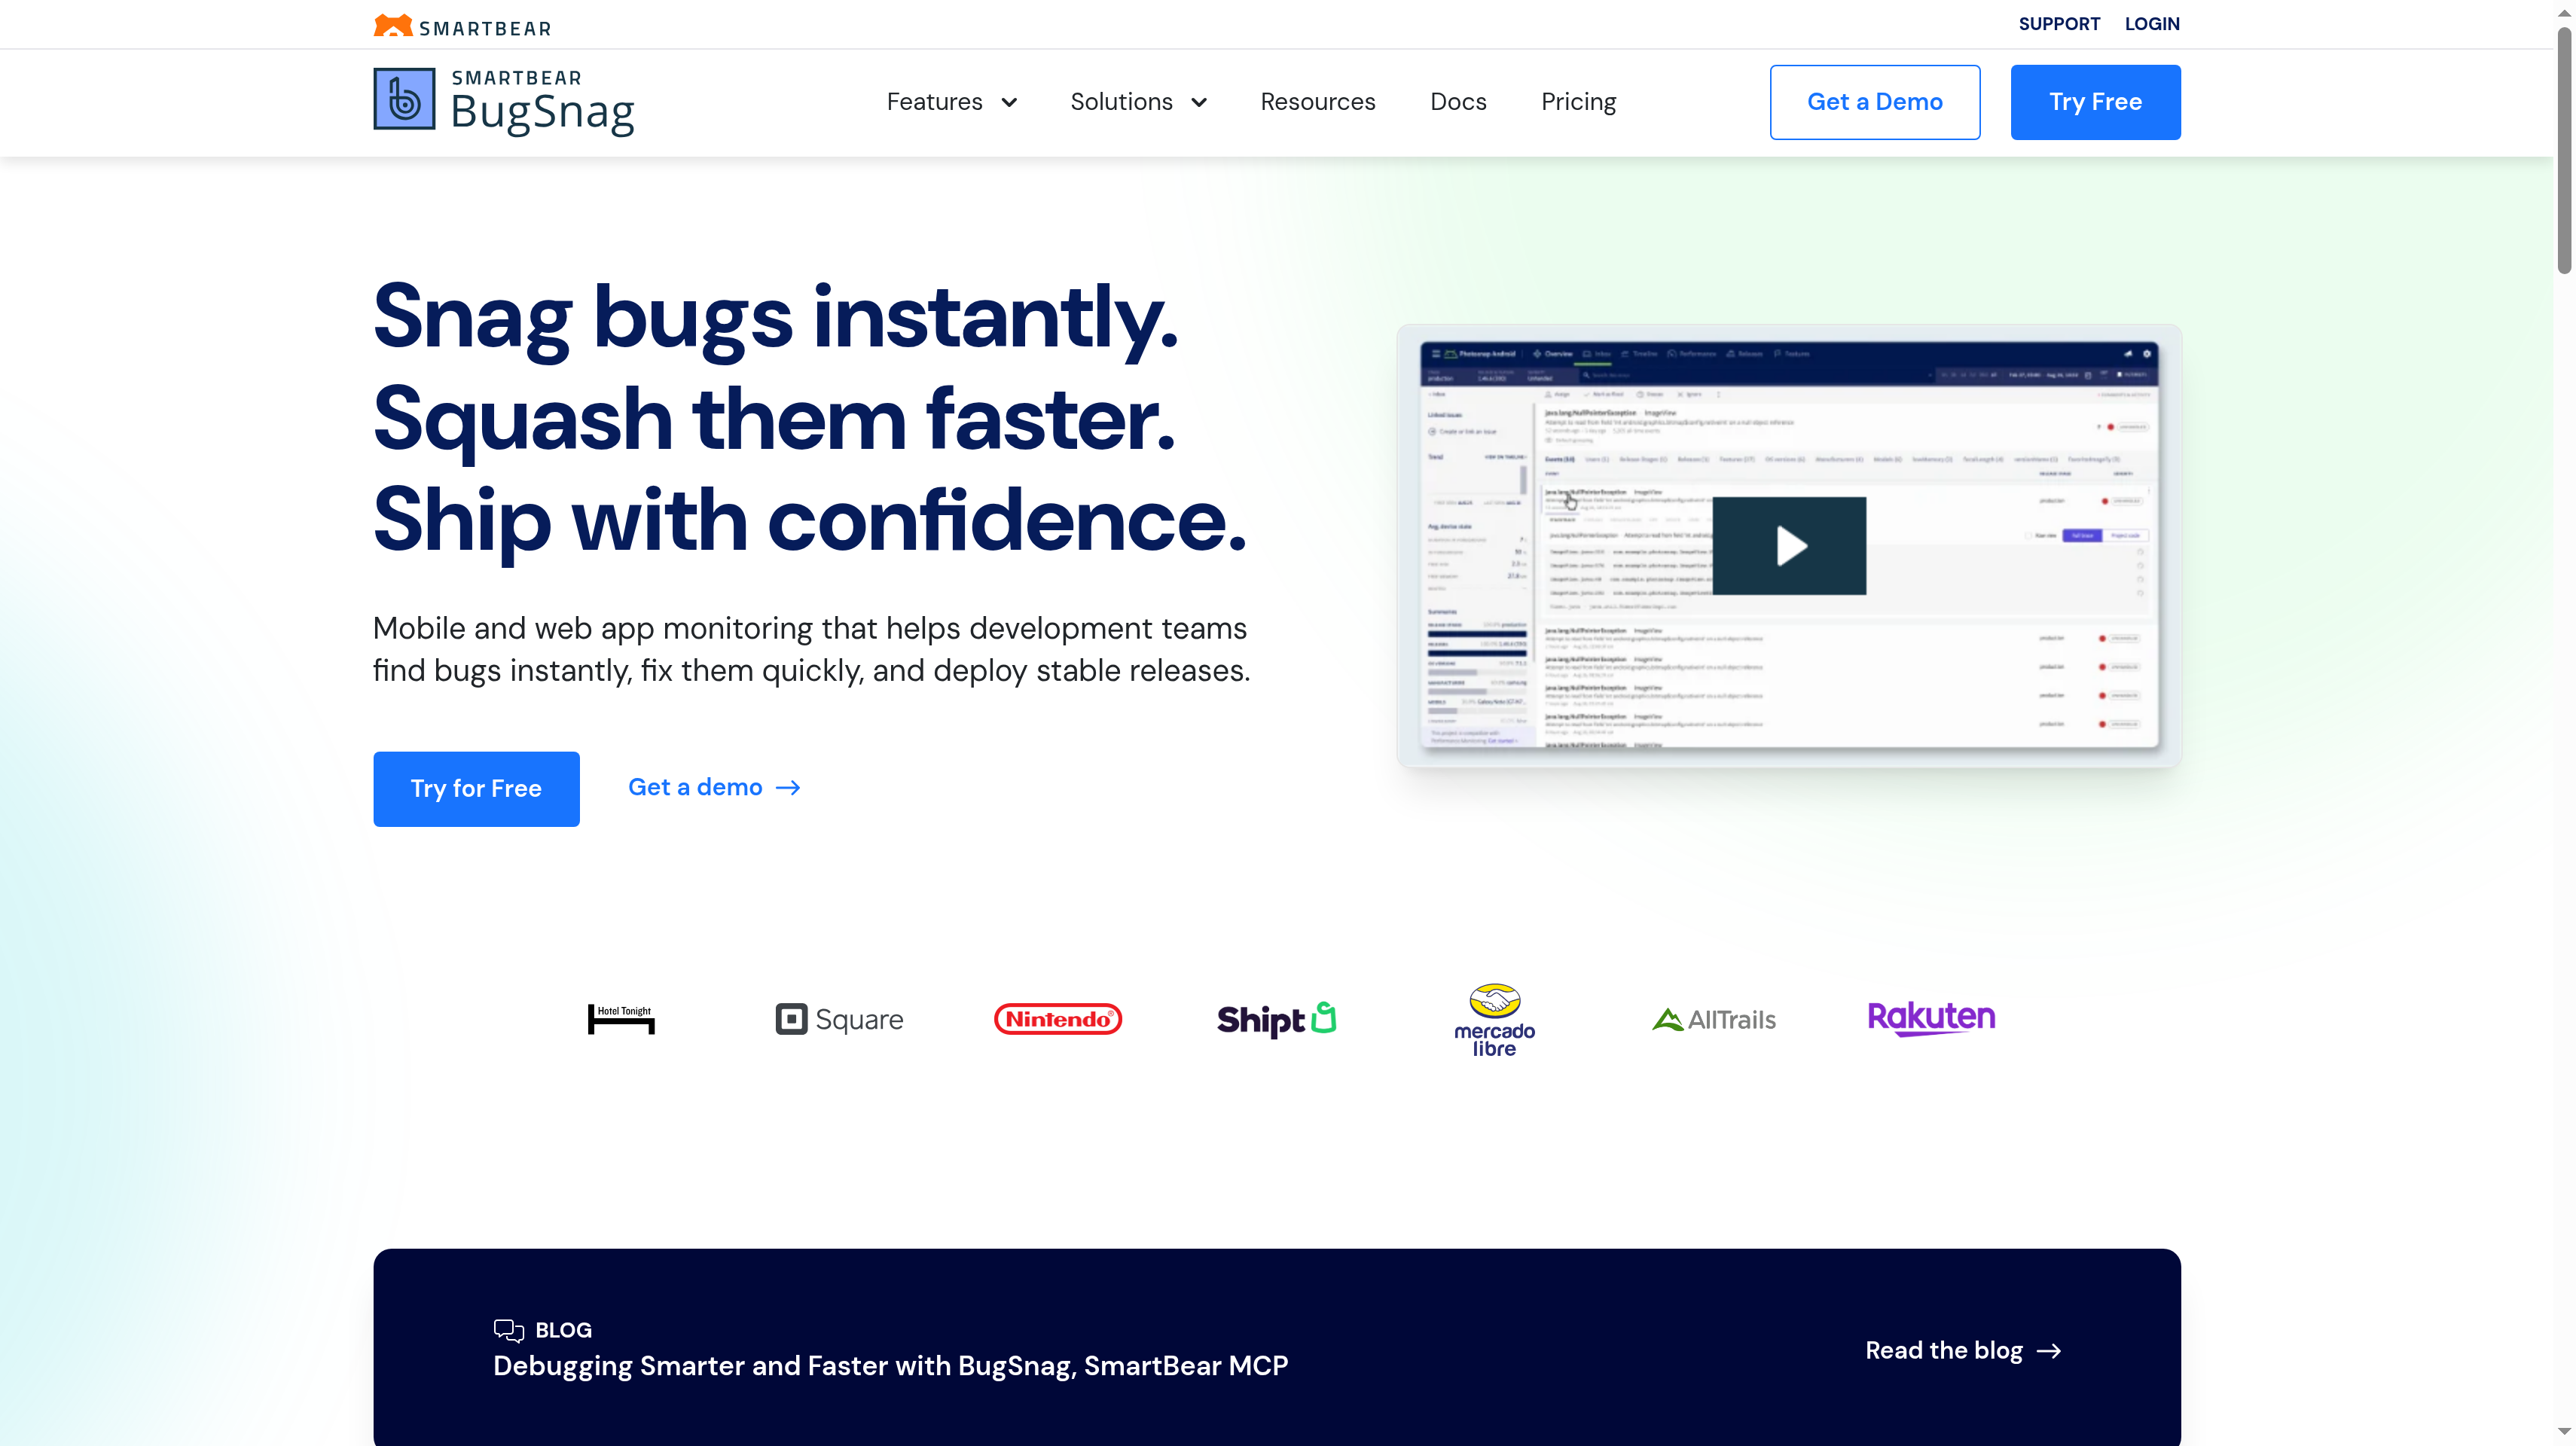
6. BugSnag, best for mobile and web teams that track app stability
BugSnag, by SmartBear, combines error monitoring and performance monitoring for mobile and web applications across more than 50 platforms. Stability scores and an error inbox prioritized by severity and user impact help you decide which failures need attention first. That is useful when the same release generates several issues and your team needs a shared way to choose the next fix.
Breadcrumbs and stack traces provide investigation context, while distributed tracing follows application work across operations. Include user-impact assessment in your evaluation. Your engineer should be able to choose a failure that affects the customer experience and understand its context before opening the code.
Free costs $0 per month for one user, with 7.5K events and 1 million spans per month. Select starts at $20 per month and includes unlimited users. Preferred starts at $33 per month and adds automatic error prioritization, stability benchmarks, and SAML SSO. Paid plans scale by monthly events and spans. Enterprise has custom pricing with on-premises or SaaS deployment, and BugSnag is also available through AWS Marketplace.
The SmartBear MCP server brings error data into your IDE with AI fix suggestions. That connects stability investigation to the place where a developer makes the change. Compare the events and spans your application will generate separately, so the budget reflects both error reporting and tracing volume.
Best suited for mobile and web teams that use stability and user impact to organize release fixes. Your engineers can investigate errors with breadcrumbs and stack traces, then bring that context into the IDE through SmartBear MCP.
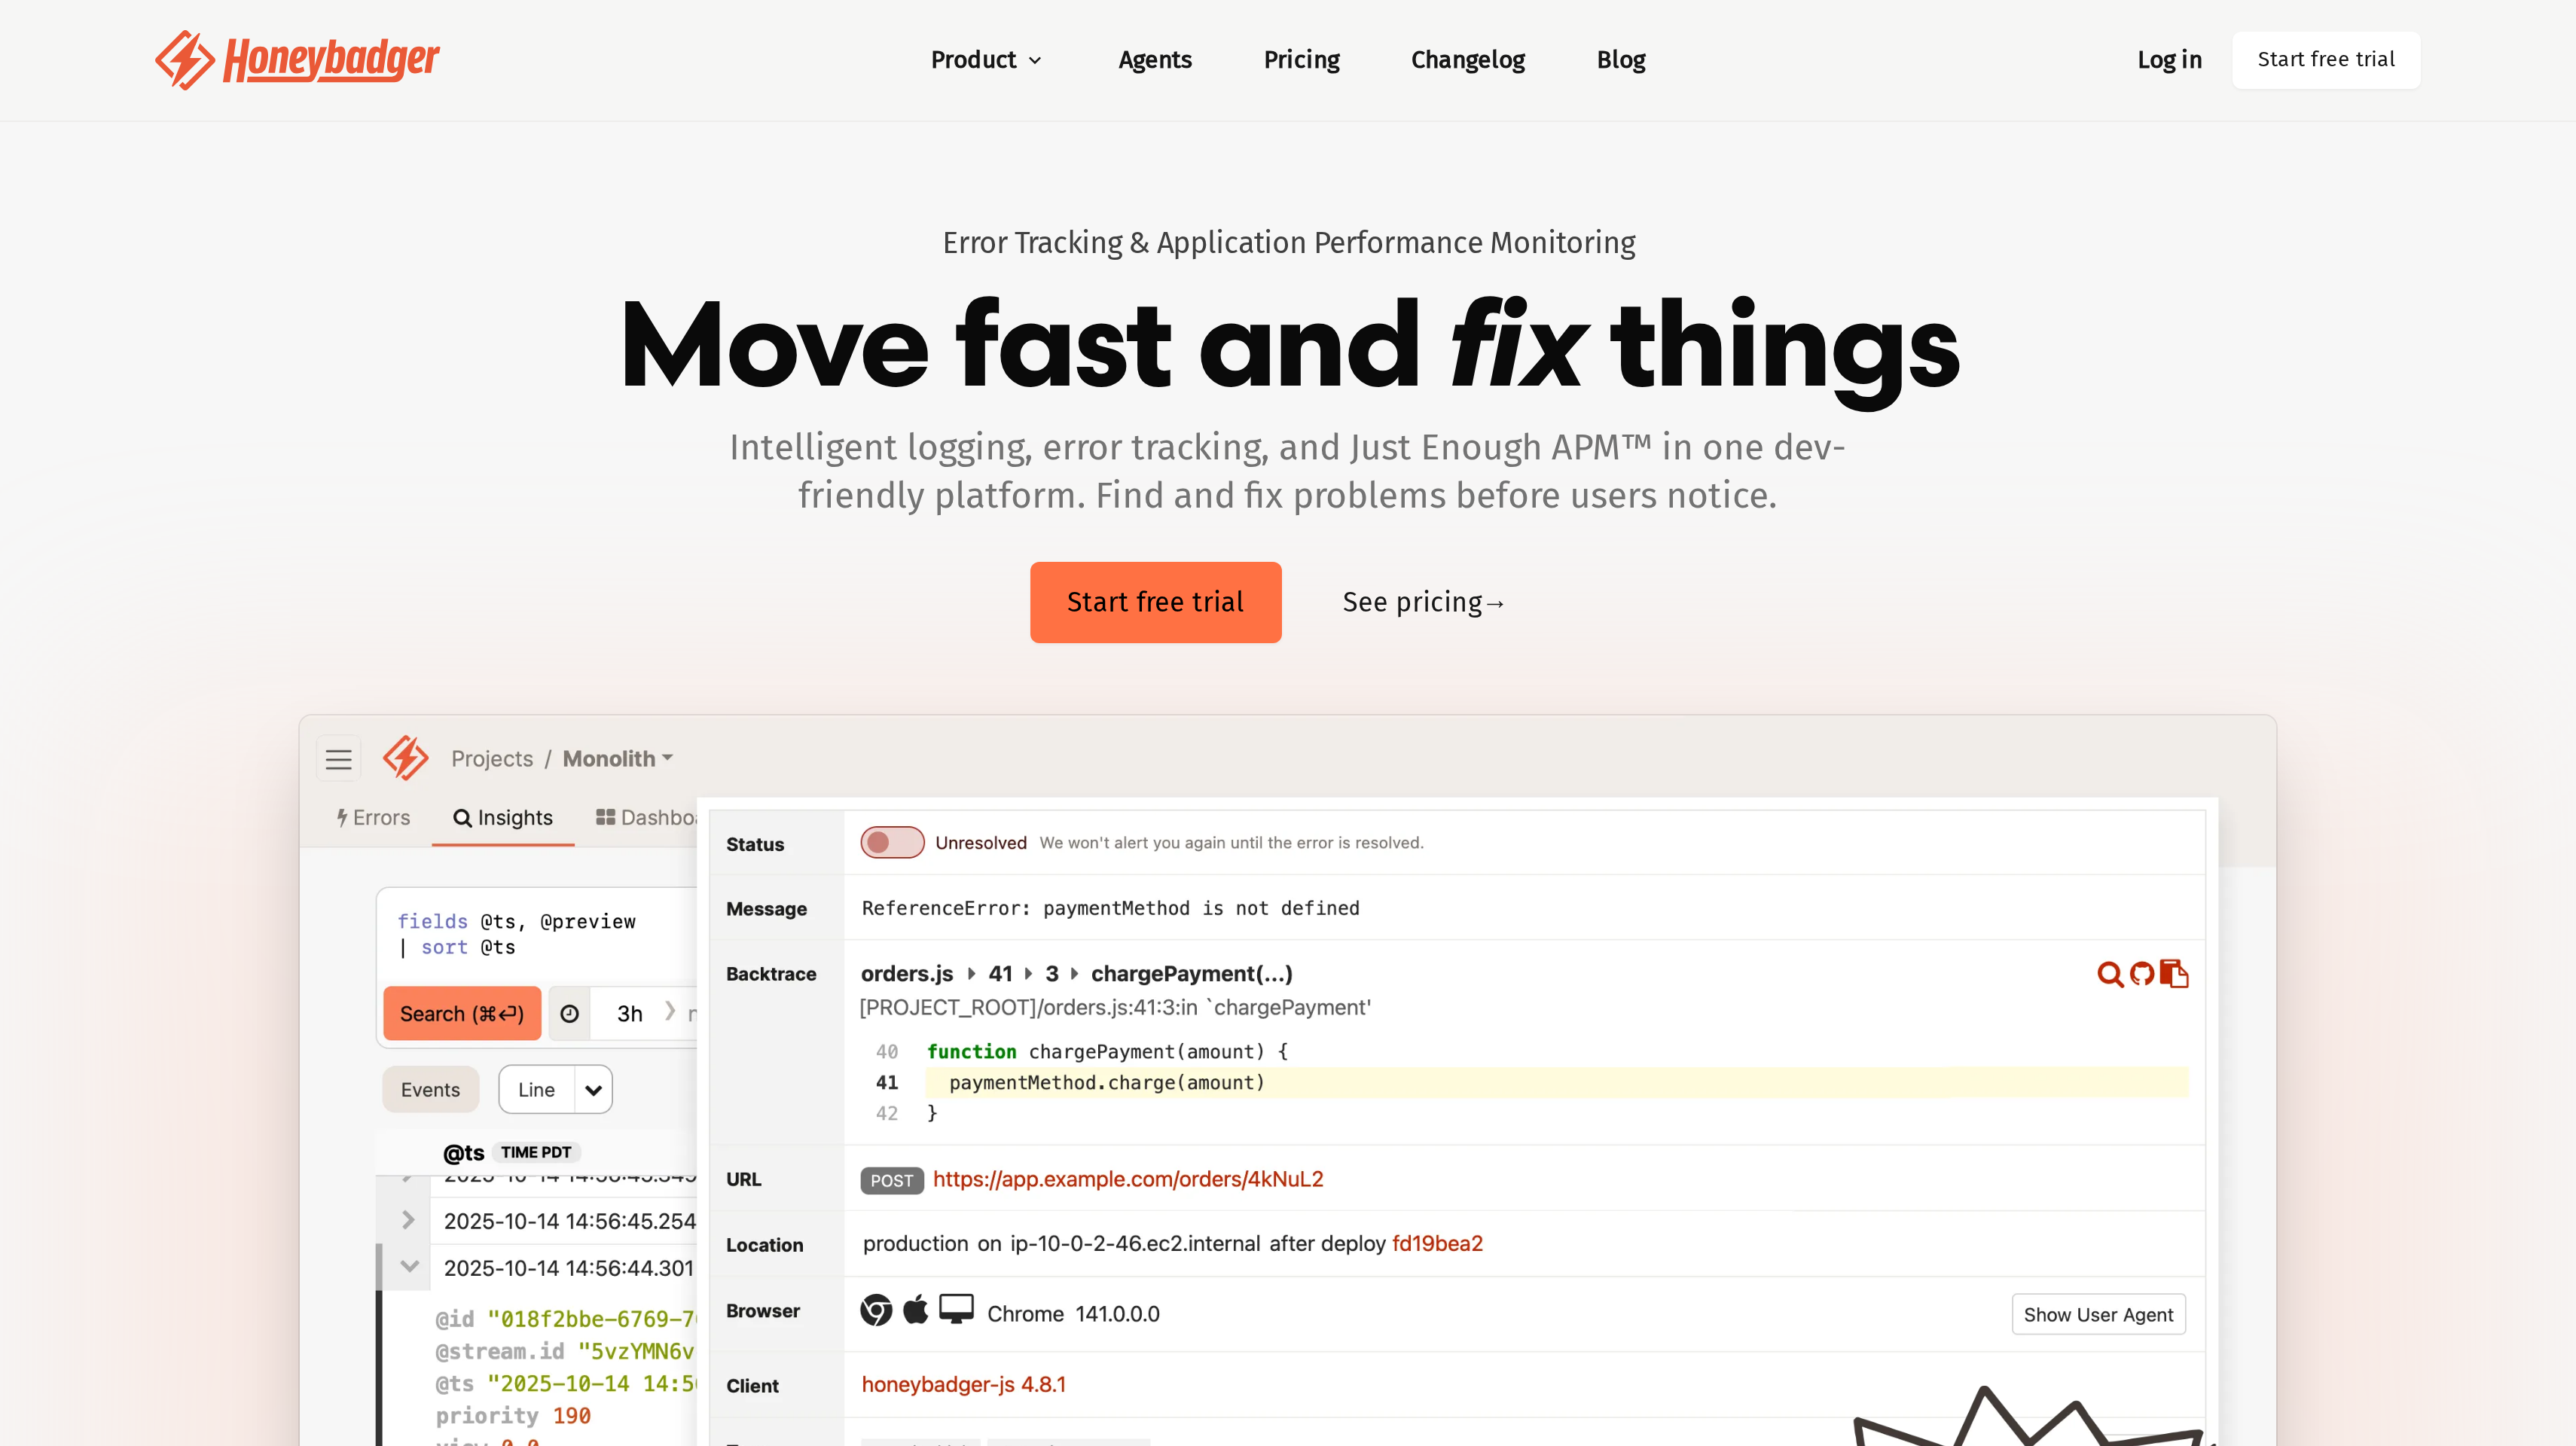
7. Honeybadger, best for small teams that want errors, logs, and uptime at a flat price
Honeybadger puts error tracking, logging, and what it calls "Just Enough APM" in one platform. Uptime monitoring, cron and heartbeat monitoring, and status pages cover availability and scheduled work alongside application errors. A small bootstrapped team has built it since 2012.
For a small SaaS team, the appeal is having the signals for everyday support work together. Test how you investigate an exception, inspect its logs, and check a background job. That scenario fits a team where the same people write code, answer support, and respond to failures.
Developer is free forever for one user, with 5,000 errors per month, 50 MB per day of performance and logging data, one uptime monitor, one status page, and 15-day error retention. Team costs $26 per month and includes unlimited users, 50,000 errors per month, five uptime monitors, and 90-day error retention. Annual Team billing is $286 per year instead of $312 across twelve monthly payments.
Business costs $80 per month and adds SOC2, HIPAA, EU data residency, SAML SSO, and 180-day error retention. Choose the tier around access, retention, and your data requirements as well as the error allowance. The daily performance and logging unit also deserves its own estimate rather than being folded into the monthly error count.
Best suited for small engineering teams that want errors, logs, availability, and scheduled-job checks in one subscription. Team gives everyone access while extending the error allowance and retention beyond the single-user Developer plan.
8. AppSignal, best for predictable APM pricing with no overage charges
AppSignal combines error tracking, performance monitoring, custom metrics, dashboards, and host monitoring. Log search and live tail help you investigate what the application reports, while distributed tracing is in beta. Uptime monitoring includes a free public status page, and cron check-ins and anomaly detection alerts add coverage for scheduled work and unexpected behaviour.
Its pricing promises are central to the fit. AppSignal states that there are no surprise invoices or overage charges, and that monitoring never stops when you cross plan limits. That makes it a useful candidate when your team wants continued visibility during an incident without an automatic overage bill. Compare that policy alongside the request allowance you expect to need.
The free plan includes 30,000 requests, 1 GB of logging, and five-day retention. A paid plan example costs $23.25 per month billed yearly at $279 per year for 250,000 requests per month. All plans include unlimited users, teams, applications, and dashboards. A 30-day free trial requires no credit card, so your engineers can evaluate the investigation workflow with the people who will use it.
Request-based capacity gives you a starting point if you already track application traffic. Include logging, cron jobs, and hosts in the evaluation. Unlimited applications and teams let you organize the account around service ownership without counting seats for each engineer.
Best suited for teams that want APM and operational checks with a clear request-based budget. Continued monitoring beyond plan limits and unlimited users fit an engineering group that wants shared access during production incidents.
Side-by-Side Comparison
The table compares investigation scope, response workflow, developer access, and pricing. Prices are USD, with billing terms shown where specified. Compare hosts, ingest, events, requests, responder licenses, and user seats against your own workload.
Tool
Price
Free plan
Best for
Sentry
Team $26/mo billed annually
1 user
Error tracking
Datadog
Infrastructure Pro from $15/host/mo billed annually
Up to 5 hosts
Full-stack observability
Better Stack
Responders $29/license/mo billed annually
10 monitors and heartbeats
Telemetry and on-call
New Relic
Additional ingest $0.40/GB
100 GB ingest/mo
Usage-based observability
Rollbar
Essentials, Advanced by volume
5K occurrences/mo
Tested AI fixes
BugSnag
Select from $20/mo
7.5K events/mo
App stability
Honeybadger
Team $26/mo
5K errors/mo
Small teams
AppSignal
Example $23.25/mo billed yearly
30K requests
Predictable APM pricing
Which application monitoring tool fits your use case
Start with the person responding to a customer problem. A product engineer needs evidence tied to code; operations may need to follow the incident across infrastructure and services.
Budget for a normal release, a busy period, and a failure producing repeated errors or extra logs. Compare the cost and context for that workload, including everyone who needs access.
Use case
What changes about the setup
What to look for
Developers own production exceptions
The investigation starts with a broken customer action and ends with a code change.
Sentry for connected error, trace, and replay context; Rollbar for a tested AI pull-request workflow.
Several teams operate the stack
Application failures need infrastructure, database, and security context.
Datadog for separately priced monitoring products; New Relic for broad coverage priced around ingest and access.
One team owns on-call and customer updates
Monitoring also needs to reach a responder and communicate service status.
Better Stack for telemetry, phone and SMS alerts, incident management, and status pages together.
Mobile and web releases need stability priorities
Engineers must rank issues by severity and the people affected.
BugSnag for stability scores, user-impact context, breadcrumbs, and stack traces.
A small team handles support and development
The same engineers investigate errors and check logs, uptime, and background jobs.
Honeybadger for combined coverage with a flat Team subscription and unlimited users.
Budget predictability is the main constraint
You need to understand what happens when traffic or incident volume crosses an allowance.
AppSignal for continued monitoring without overage charges; Rollbar for processing that stops at the limit by default.
Proof: What results look like
Once production monitoring is in place, a partner channel is a separate growth decision. In his published Affonso testimonial, supastarter founder Jonathan Wilke says affiliates bring in more than half of the company's customers. He describes onboarding partners and paying their commissions through the platform.
SocialRails founder Matt reports getting Affonso set up in 30 minutes and receiving eight leads when he shared his testimonial. Both accounts describe the partner channel you can build once your operating stack is in place.
Use the published customer testimonials to see how those teams describe their programs. Then model a reward with the affiliate commission calculator and measure referred leads, paying customers, and commissions separately from your production-health metrics.
FAQ
What are the best application monitoring tools for a small SaaS team?
Sentry ranks first here for developers who want errors connected to tracing and session replay. Honeybadger fits a small team buying errors, logs, uptime, and status pages together, while AppSignal suits request-based APM budgeting. Start with the failure your team most often investigates and the number of people who need access.
What is the difference between error tracking, APM, and observability?
Error tracking records failures with the context needed to investigate them. APM examines application performance, including where requests spend time. Observability combines signals such as logs, metrics, and traces across the system, so your team can investigate problems that cross service or infrastructure boundaries.
How much do application monitoring tools cost?
Sentry Team costs $26 per month billed annually, and Honeybadger Team costs $26 per month on monthly billing. Datadog Infrastructure Pro starts at $15 per host per month billed annually, with APM and logs separate. Compare those billing units with New Relic's ingest and user charges before estimating your total.
What should I look for in Sentry alternatives?
Choose around the part of the workflow you want to emphasize. Rollbar offers Resolve for tested AI pull requests, BugSnag organizes errors around app stability and user impact, and Honeybadger combines error tracking with logs and availability checks. Datadog and New Relic fit a broader observability evaluation spanning infrastructure and application data.
How do AI debugging and MCP access differ?
MCP connects monitoring data and supported tools to a compatible assistant; it does not by itself mean the assistant ships code. Sentry offers Seer AI debugging, SmartBear MCP brings BugSnag data and fix suggestions into the IDE, and Rollbar Resolve writes a patch, runs tests, and opens a pull request for approval.
What happens when I reach a monitoring plan limit?
The policy depends on the product. Sentry bills additional events and data by volume, while Rollbar stops processing events at the limit by default. AppSignal promises that monitoring continues without overage charges, so compare both the invoice policy and whether the tool keeps collecting data when usage exceeds your allowance.
How should I test a monitoring tool before choosing it?
Instrument a customer journey, trigger a controlled error in a test environment, and follow the evidence through to a proposed fix. Check whether the alert reaches its owner and whether a colleague can repeat the investigation. Include a slow request and a missed scheduled job when those are part of your operational responsibilities.
How do I keep partner activity visible alongside production alerts?
Affonso has no native integration with these monitoring tools. Use webhook events and Slack notifications to route partner and payout activity alongside your monitoring alerts, with separate channels or routing for each audience. The affiliate software shortlist covers the tools for running that channel.
Try for free
Choose the monitoring scope your engineers can use and maintain. Connect a real customer journey, assign an alert owner, and follow an issue through to a reviewed fix. Include the people who respond to incidents when you compare access and cost. Once that setup is working, give the customers and creators who recommend your product a partner program. Track the referrals they send and the commissions they earn. Start your Affonso free trial.
 Affonso
 Silvestro Zinnanti, FounderComparisonNovember 6, 202621 min read